Air Pollution Images and Video of Mainland China, Taiwan and South Korea
Please note that this page has ~150 MB of content and may take a few minutes to download
Also because of file format limiations, several of the videos require Windows MediaPlayer
Air Pollution Beijing
(Fig. 2) Beijing Airport in September, prior to the new international terminal building looking east. Visiblity about 1.5 miles (2.4 km). Click for (hi res)
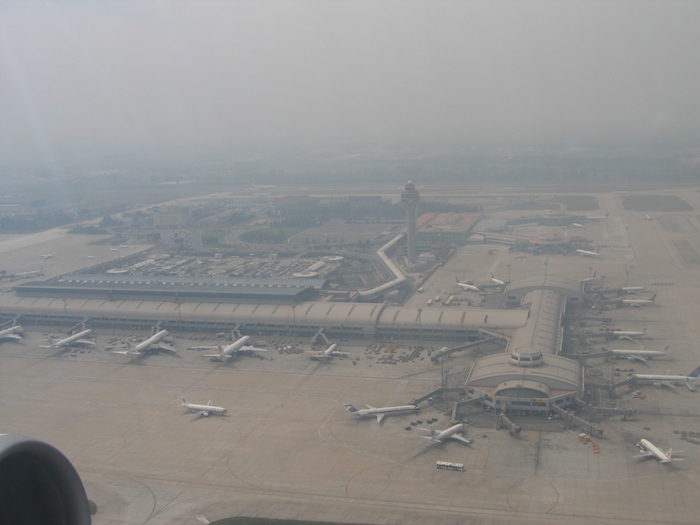
(Fig. 3) Beijing Airport in August, post the start of the construction of the new international terminal building and barely discernible in the photo, looking west towards Beijing. In this situation, the domestic flight was passing the airport heading north and to the east, in the process of performing an orbit of the airfield. The flight originally arrived from the south and west of the airfield, and after a 360 degree flyover, landing in the same direction on runway 01, 01 being barely visible in the photo on the east side (near field) of airport. My suspicions being, as the air traffic patterns were not heavy and with poor visibility, is that the flyover of the Beijing airport was performed as a safety measure so that the pilots could make a visual confirmation of the field and its location first, regardless of instrumentation capability, prior to attempt their landing approach. Visiblity less than 1.0 miles (1.6 km). Click for (hi res)
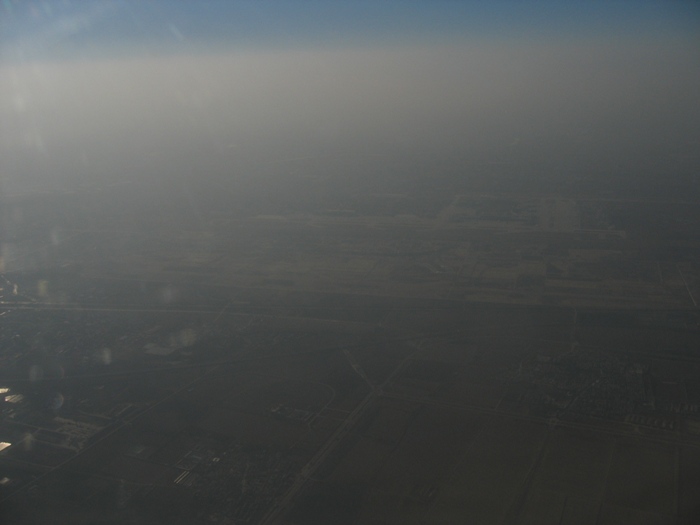
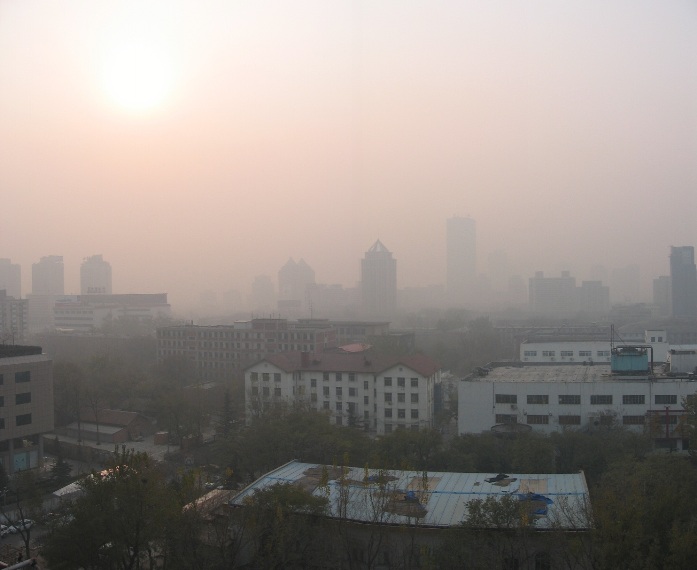
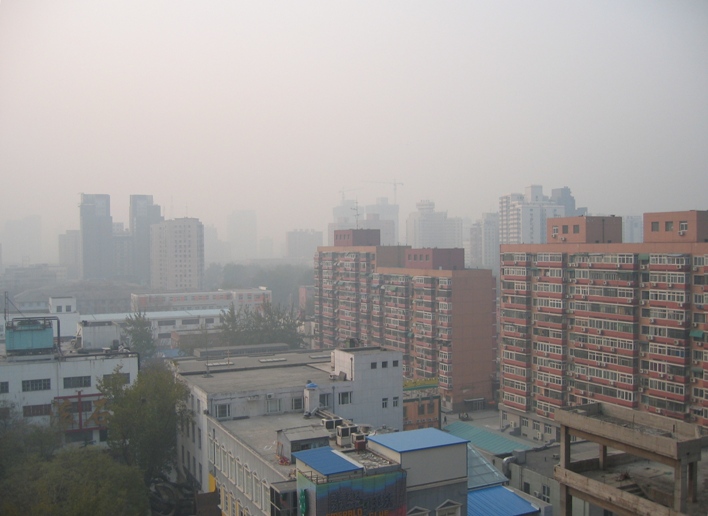
(Fig. 4) Air pollution in November over the Shuanqiao area of eastern Beijing. Visibility at altitude, estimating to be 5,000 feet (1500 m) about 3.0 miles (4.8 km), with visible at ground level being much less. Click for (hi res)
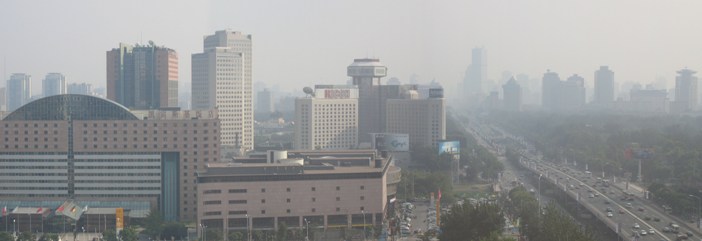
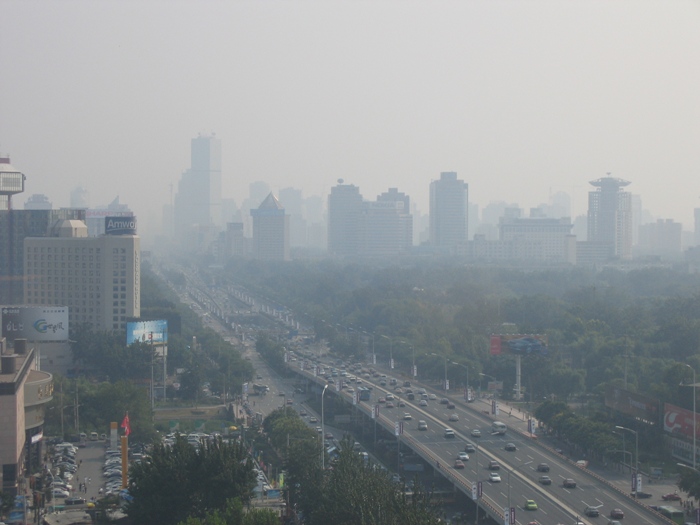
(Fig. 5) Beijing East 3rd Ring Road in June, Chaoyang District, looking south from the Hilton Hotel. Visiblity about 2.0 miles (3.2 km). Click for (hi res)
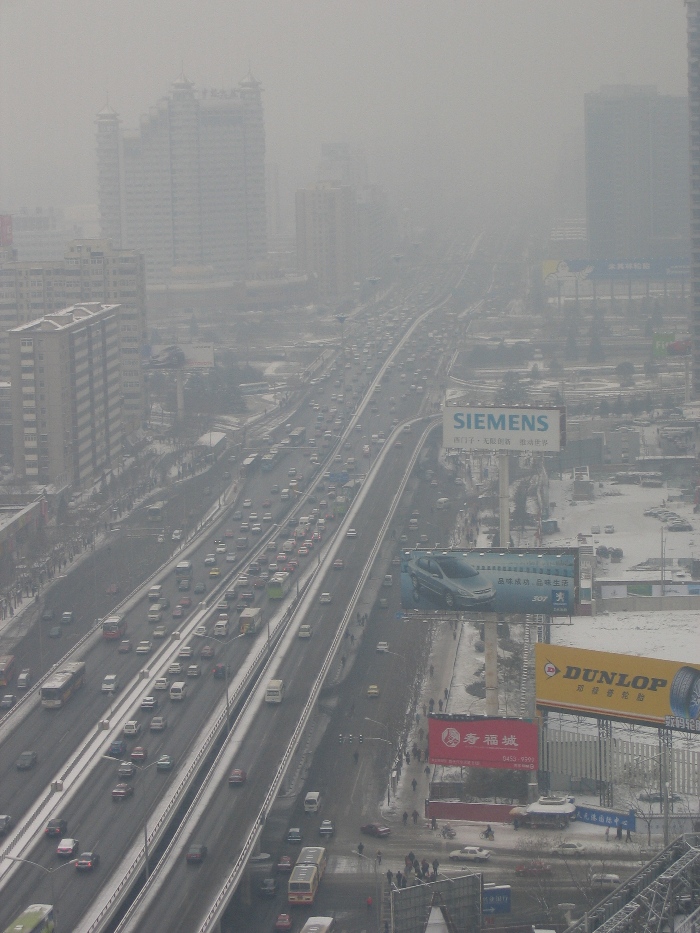
(Fig. 6) Beijing East 3rd Ring Road in December, looking north from Hilton (not fog).This very dark and heavy soot filled air, and perhaps reminiscent in composition and density to the reported and horrendous air pollution present in 19th century England, coming from the burning of coal. Many of the small shops, restaurants, and very poor homes, in particular the hautong districts, consuming vast quantities of compressed cylindrical shaped coal pellets, typically about 4" - 6" inches (100 - 150 mm) in diameter by 4" inches (100 mm) tall, (Fig. xx) used primarily for heating and cooking. The coal merchants with their small carts, plying the streets and sidewalks of most neighborhood of every city, selling door to door. The air inside many of the building and apartment towers, during such times of extensive carbon particle based suspended air pollution, in and around Beijing and all populated city in China, being noticeably less transparent, the air indoors appearing foggy, less mechanically pre filtered using an HVAC system. Visabilty about 0.75 miles (4.8 km). Click for (hi res)
[1]
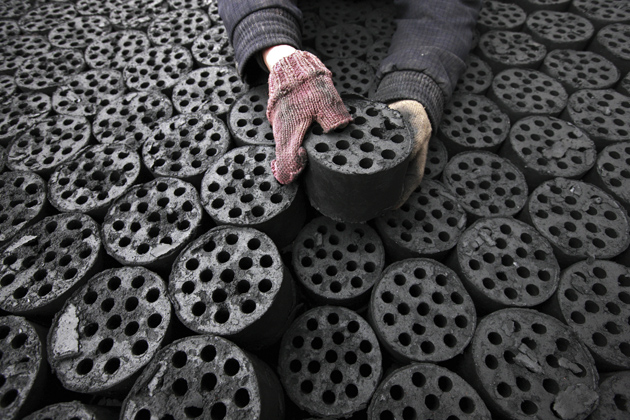
(Fig. 7) Coal pellets wanting to be distributed by pedicarts in Huaibei, Anhui Province, China (STR/AFP/Getty Images, 2013).[1]
(Vid. 1) Video taken in December panning from south to north along 3rd Ring Road towards the Chaoyang District from the Hilton Hotel. (8.97 MB file, and may take a couple minutes to download). Visiblity about 1.5 miles (2.4 km). Click on the image to start the video. Windows MediaPlayer application required.
(Fig. 8) Central Beijing area in June looking east northeast. Visiblity about 2.5 miles (4.0 km). Click for (hi res)
(Fig. 9) Central Beijing area in June looking east southeast. Visiblity about 3.0 miles (3.2 km). Click for (hi res)
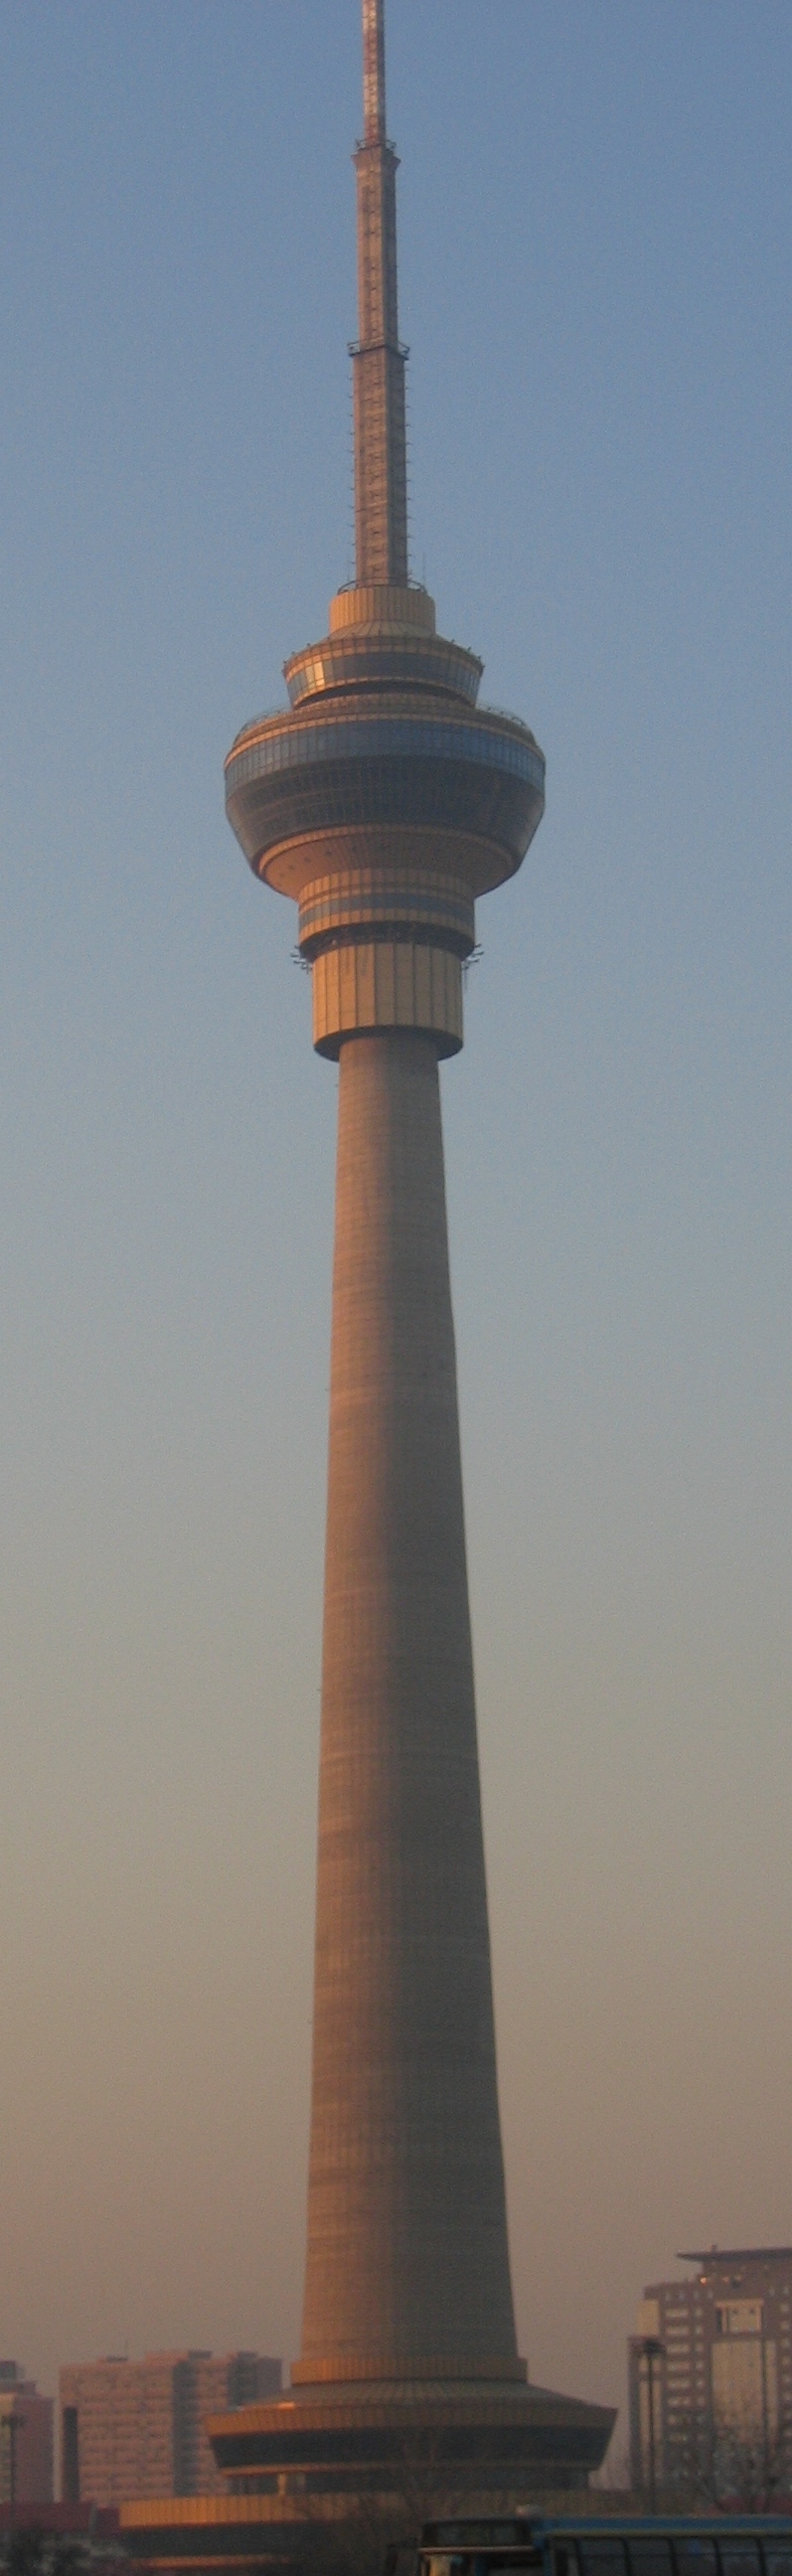
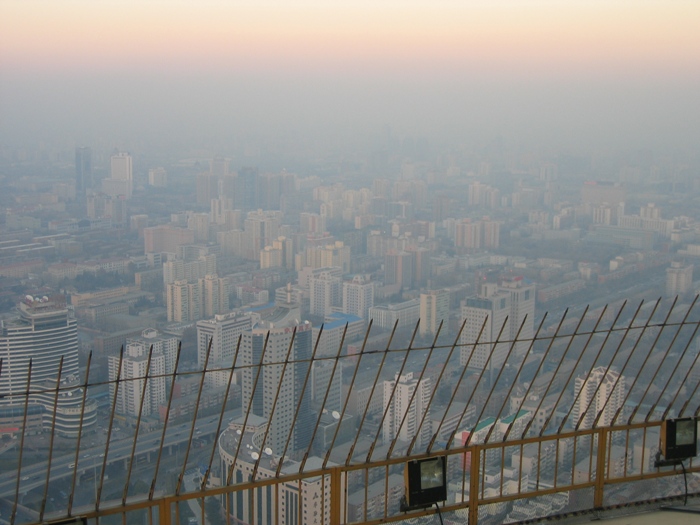
(Fig. 10, left) Photo of the 1,329 feet (405 m) CCTV Tower and antenna. The outdoor observation deck being 781 feet (238 m). (Fig. 11, right) Beijing from the observation deck at the CCTV Tower looking northeast. Visiblity about 2.0 miles (3.2 km). Click for (hi res)
(Vid. 2) Video panorama taken in November, looking south to north at Beijing from the CCTV Tower observation deck 781 feet (238 m). The body of water is Bayi Lake (thin) and Yuyuan pond (wide). Visibility is about 2 miles (3.2 km). (8.35 MB file, and may take a couple minutes to download). Click on the image to start the video. Windows MediaPlayer application required.
(Fig. 12) Zhongguancun Area in November, near Beijing University. Visiblity about 1.5 miles (2.4 km). Click for (hi res)
(Vid. 3) Video, taken in November while travelling west on 4th Ring Road near Zhongguancun Area, Haidian District (12.7 MB file, and may take a couple minutes to download). Visiblity about 1.5 miles (2.4 km). Click on the image to start the video. Quicktime application required.
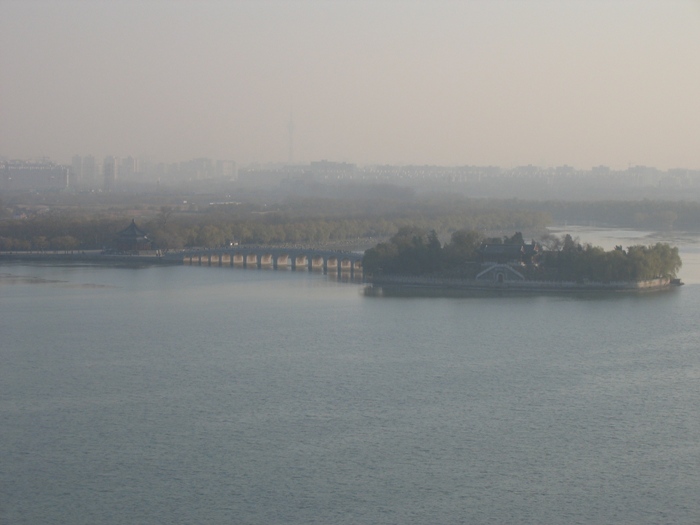
(Fig. 13) Beijing as seen from the Summer Palace hilltop in November, looking south across Kunming Lake. Just visible left of center is the CCTV tower 1,329 feet (405 m) at ~5 miles (8.0 km) away. From this photo, one can crudely ascertain how the air pollution density varies in the first 1,500 feet above the ground. In this situation, the air remaining of low quality with little variation in the transparency of the CCTV tower image for its entire height. This being a fairly typical day for Beijing, best I've witnessed being a 15 mile visibility day on a cold winter morning. Click for (hi res)
(Vid. 4) Video panorama of Beijing on a fair June day, with light wind, looking east to south, from the hilltop at the Summer Palace. Visibility is about 5 miles (8.0 km) Click on the image to start the video. Windows MediaPlayer application required.
(Fig. 14) Air pollution taken in November over western Beijing overlooking the industrial Mentougou district, prior to the competition of the 6th Ring Road. Mote the shadow being cast upon the ground from the smoke plumes. Visibility about 3.0 miles (4.8 km). Click for (hi res)
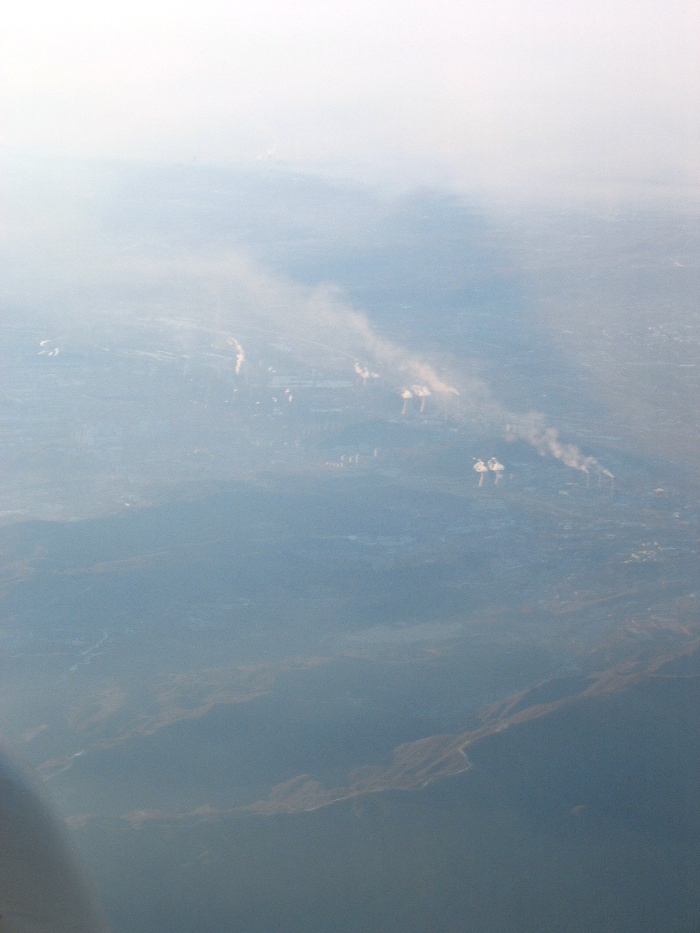
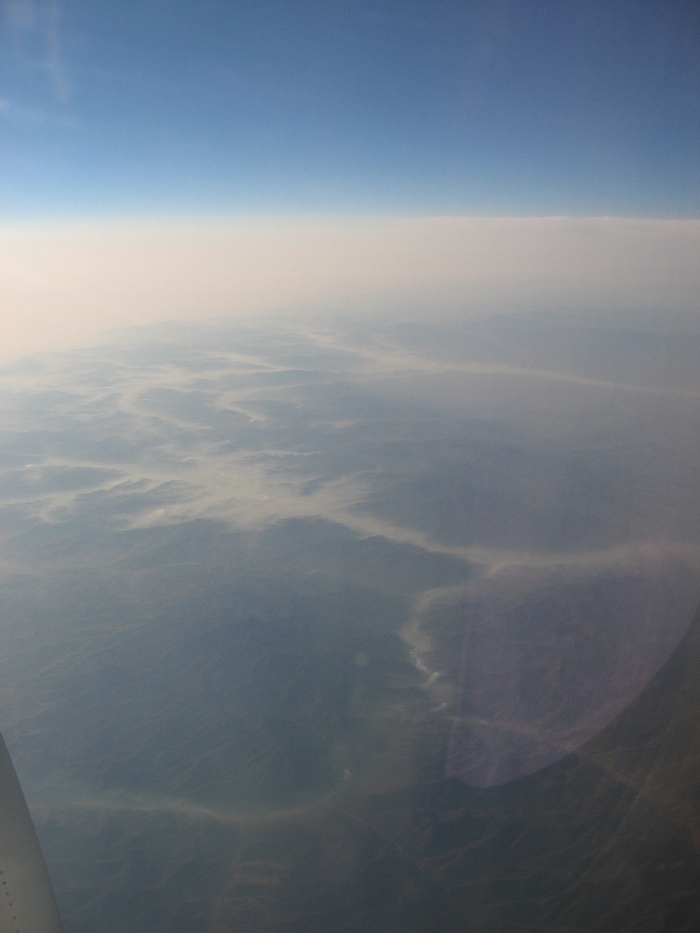
(Fig. 15) Pollution on flat plain and river valleys south and west of Beijing. Click for (hi res)
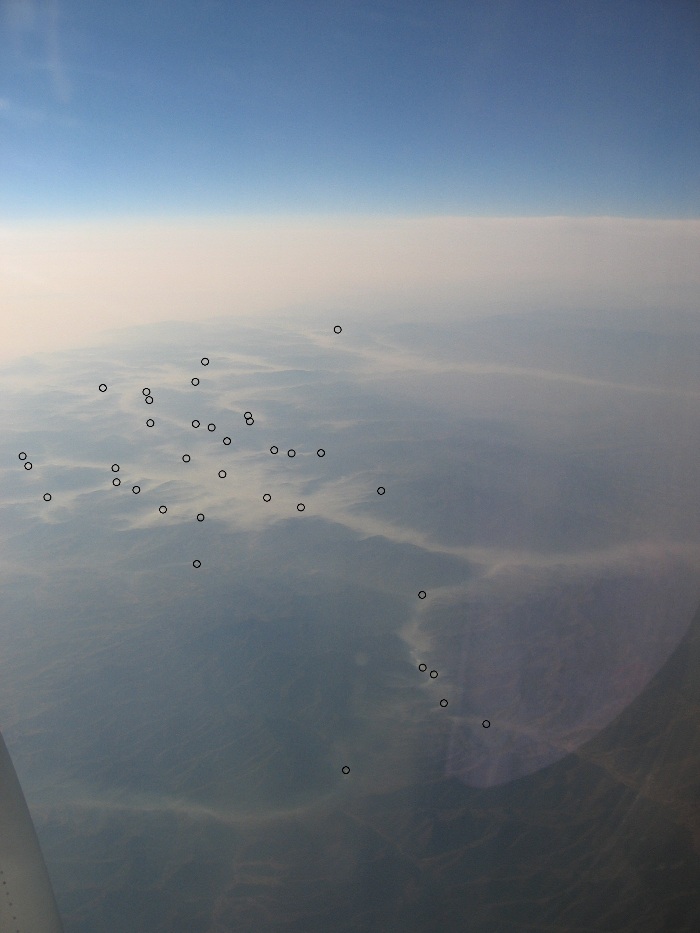
(Fig. 16) Pollution on flat plain and river valleys south and west of Beijing with the visable sources indicated. Click for (hi res)
Air Pollution Shanghai
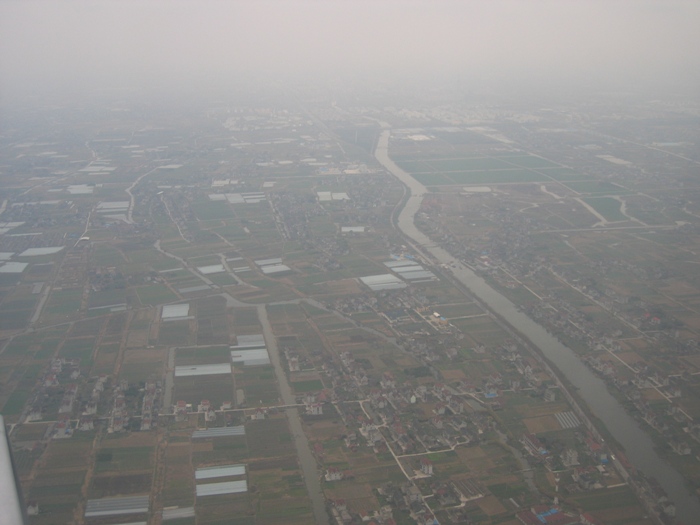
(Fig. 18) Shanghai Pudong Airport approach looking north.Visiblity about 2.5 miles (4.0 km). Click for (hi res)
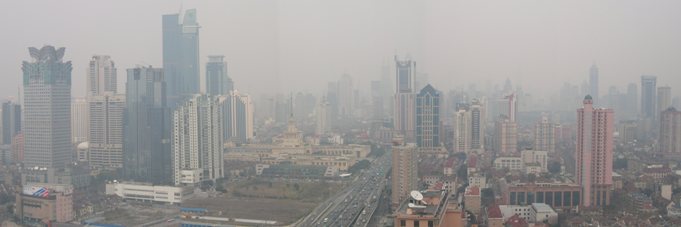
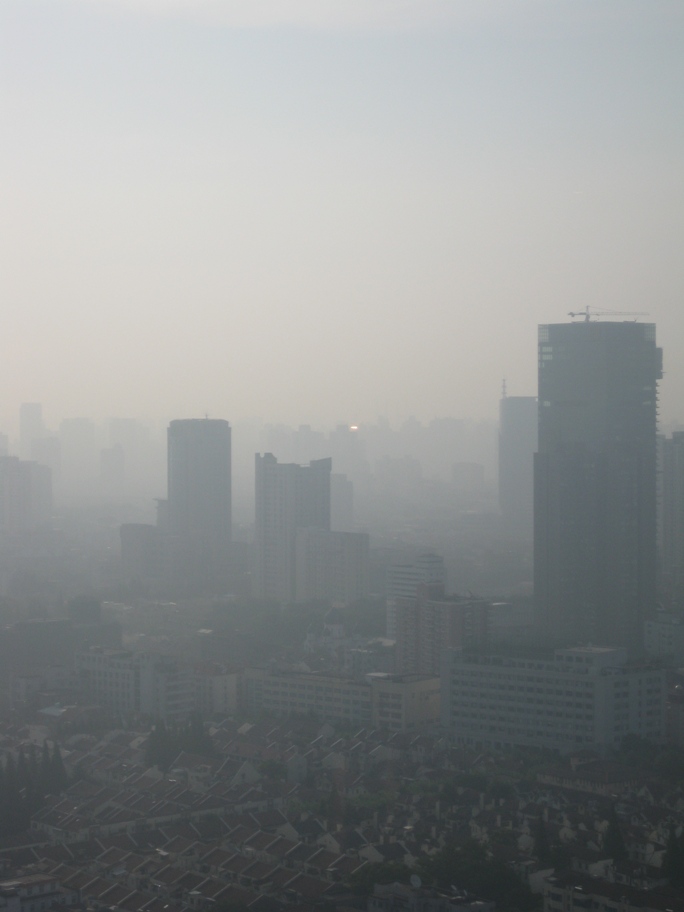
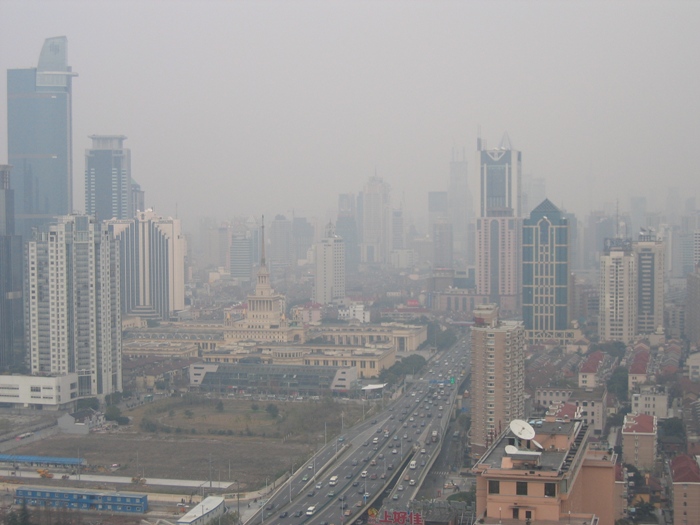
(Fig. 19) Shanghai Central Business District in July with the Mandarin Hotel at left. Viewed from the Shanghai Hilton Hotel in the Yan'an District. Visiblity about 2.5 miles (4.0 km). Click for (hi res)
(Fig. 20) Shanghai Central Business District in July with the Jin Mao and Shanghai Financial Center buildings being barely visible. Viewed from the Shanghai Hilton Hotel in the Yan'an District. Visiblity about 2.5 miles (4.0 km). Click for (hi res)
(Fig. 21) Shanghai Central Business District in July with the Sun rising in the South East. Viewed from the Shanghai Hilton Hotel in the Yan'an District. Visiblity about 2 miles (3.2 km). Click for (hi res)
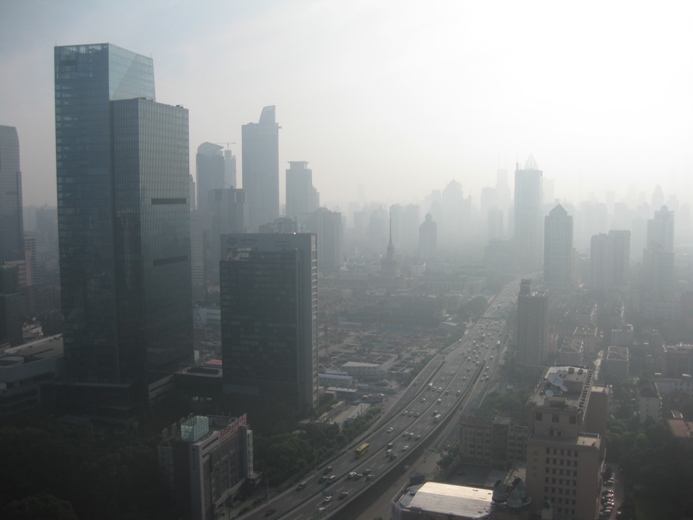
(Fig. 22) Shanghai Yanan District in September, prior to the construction of the Mandarin Hotel, looking east along the elevated Yanan Expressway from Hilton Hotel, 32th floor. Visiblity about 2.0 miles (3.2 km). Click for (hi res)
(Vid. 5) Video panorama (less than stable) looking east towards central Shanghai and Pudong as seen from the Hilton Hotel located in the Yan'an District. (18.2 MB file, and may take a couple minutes to download). Visiblity about 2.5 miles (4.0 km). Click on the image to start the video. Quicktime application required.
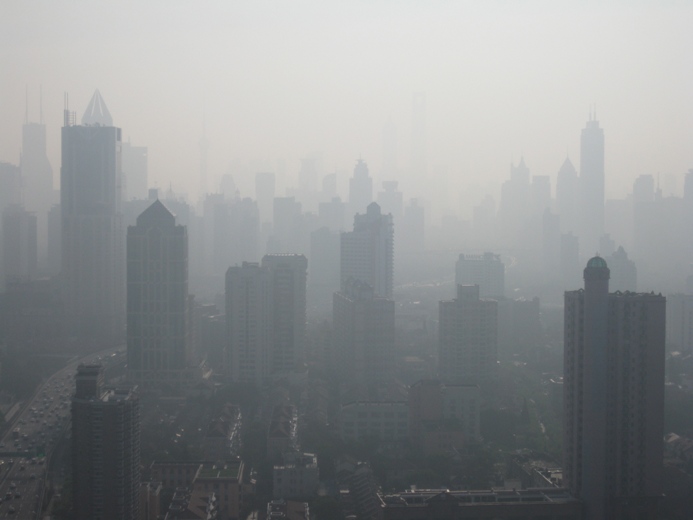
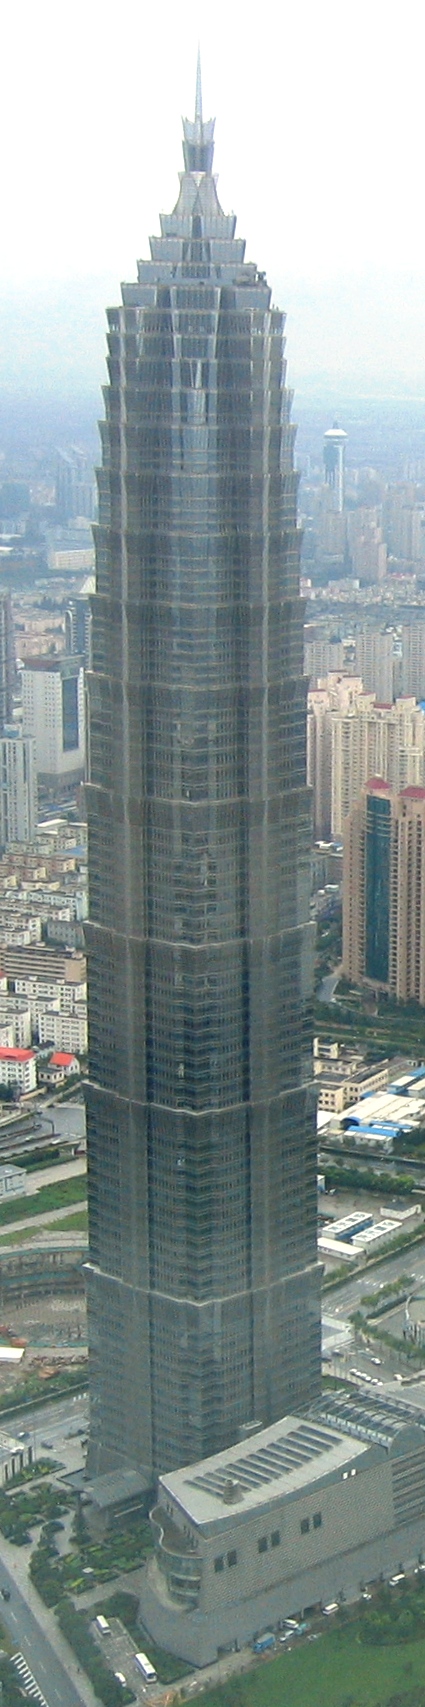
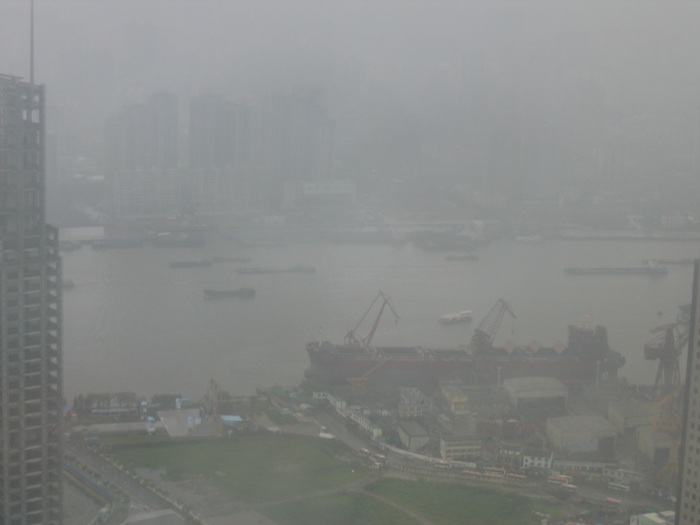
(Fig. 23, left) Photo of the 1,381 feet (421 m) 88 story Jin Mao building in the Pudong District of Shanghai as seen from the 1,535 feet (468 m) Shanghai Pearl of the Orient TV Tower observation deck at 1,148 ft (350 m) on a rainy September day. (Fig. 24, right) Shanghai Huangpu River and North Bund District in December (prior to Bund reconstruction) looking west from the Grand Hyatt Hotel located in the Jin Mao Building. Visiblity about 1.5 miles (2.4 km). Click for (hi res)
(Vid. 6) Panorama video looking west, towards the Huangpu River and Bund in central Shanghai during the month of December as seen from the Grand Hyatt Hotel in the Jin Mao Building located in the Pudong District. The large vacant area near the base of the Jin Mao building now occupied by the Shanghai Financial Center. (9.65 MB file, and may take a couple minutes to download). Click on the image to start the video. Windows MediaPlayer application required.
Air Pollution Tianjin
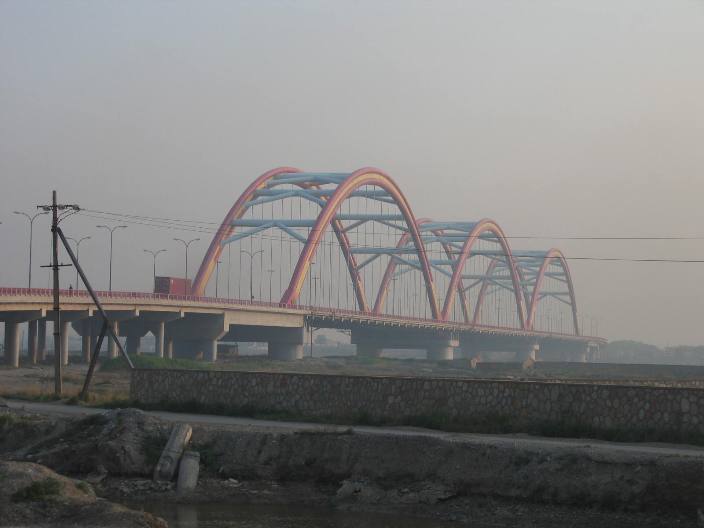
(Fig. 25) Rainbow Bridge Beitang-Bei Tang Fu Jin de Cai Hong Da Qiao, outside of Tianjin. Visiblity about 2.0 miles (3.2 km). Click for (hi res)
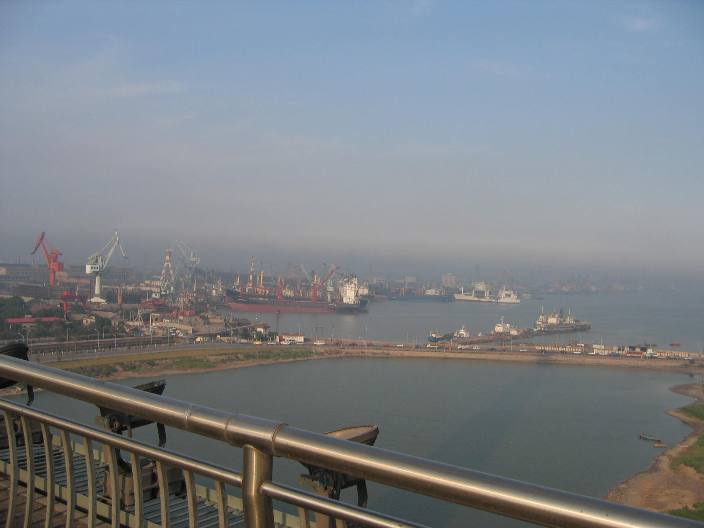
(Fig. 26) Photo of Tianjin harbor on a nice day in June, looking towards the east from the south cable stayed bridge tower on the Haihe Bridge, just east of central Tianjin. The large mass of air pollution from as far away as Taiyuan, Shijiazhuang, and Beijing leaving China by way of the Bohai Sea to collect with pollution departing from Dalian and Yantai. Visibility about 2.5 miles (4.0 km). Click for (hi res)
Air Pollution Xian
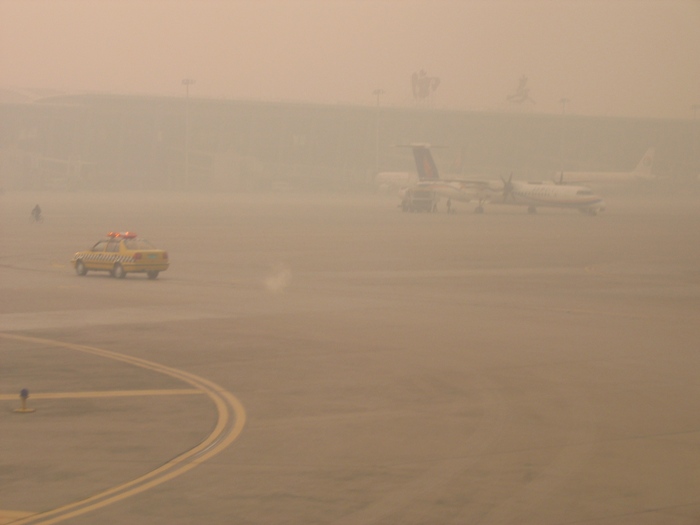
(Fig. 27) Xian Airport in the month of November, looking south. The small airport "taxing" vehicle having been sent out to meet the aircraft to help giude it to the terminal gate. Note the puff of exhuast from the airport vehicle. Visiblity about 0.75 miles (1.2 km). Click for (hi res)
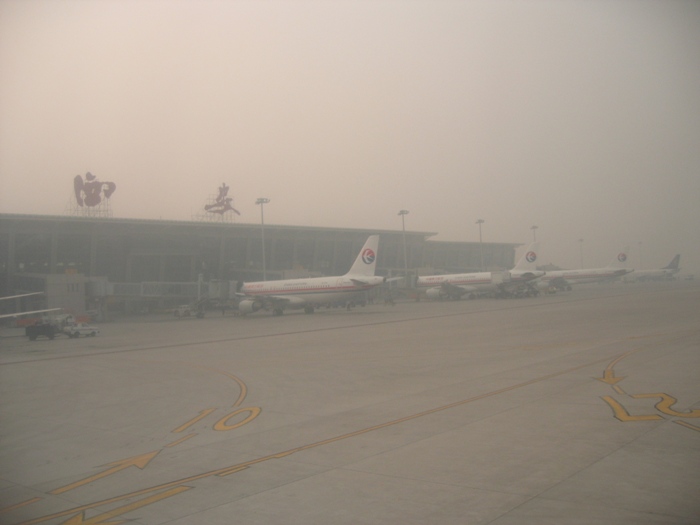
(Fig. 28) Xian Airport Terminal looking towards the southwest. The fifth light pole on the tarmac nearly disapearing. Visiblity about 0.75 miles (1.2 km). Click for (hi res)
(Vid. 7) Video of mid day arrival into Xian on Runway 23R. The low Visiblity is not the result of fog. (7.39 MB file, and may take a couple minutes to download). Visiblity about 0.75 miles (1.2 km). Click on the image to start the video. Quicktime application required.
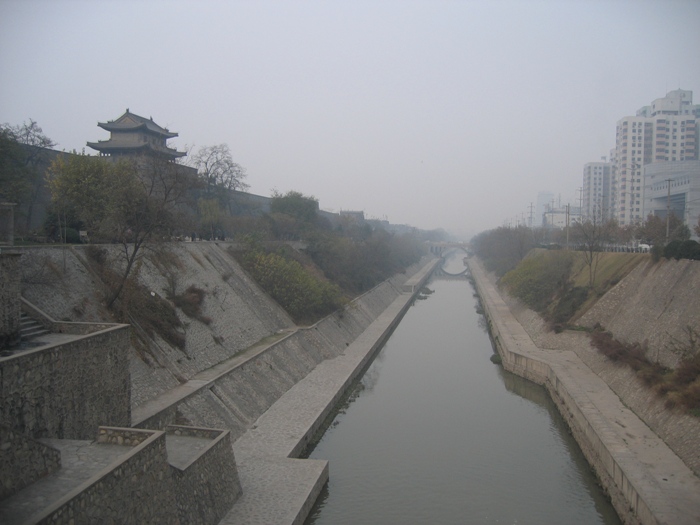
(Fig. 29) Xian City Wall, Main East Gate bridge looking north. Visiblity about 1.5 miles (2.4 km). Click for (hi res)
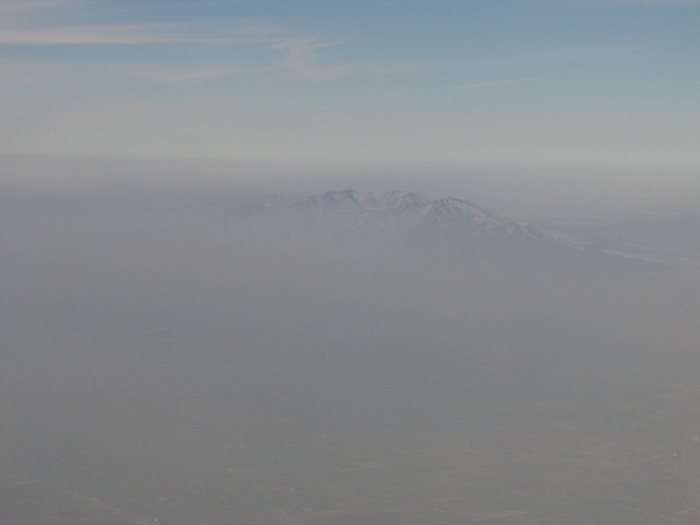
(Fig. 30) View of region just west of the city of Sanyuan, about 25 miles north of Xian, looking towards the northwest at southeast face of Laolong Shan (Mt. Laolong) near center frame. Click for (hi res)
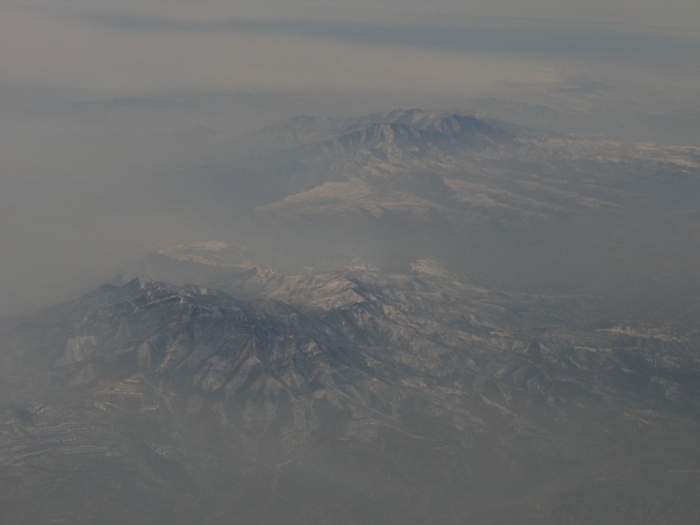
(Fig. 31) View of region just west of the city of Sanyuan, about 35 miles north of Xian, looking towards the northwest at the southeast face of Laolong Shan (Mt. Laolong) near center frame. Click for (hi res)
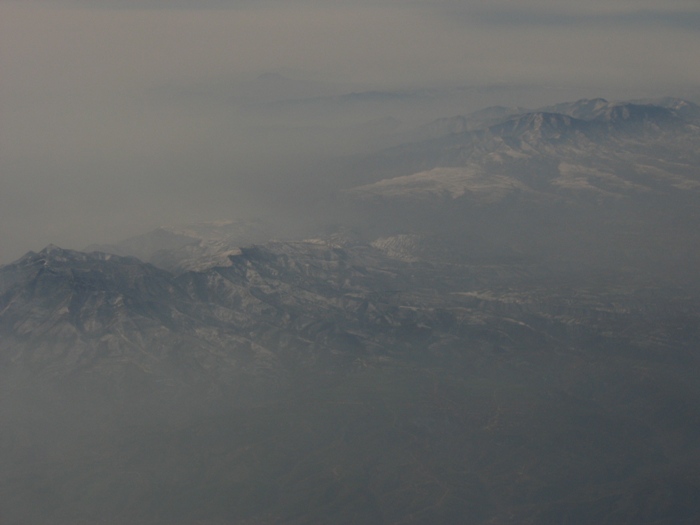
(Fig. 32) View of region about 5 miles north of Fungcun Reservoir, about 40 miles north of Xian, looking towards the southwest at the northeast face of Laolong Shan (Mt. Laolong) near right frame. From this vantage point, Laolong Shan is about 20 miles distant. Click for (hi res)
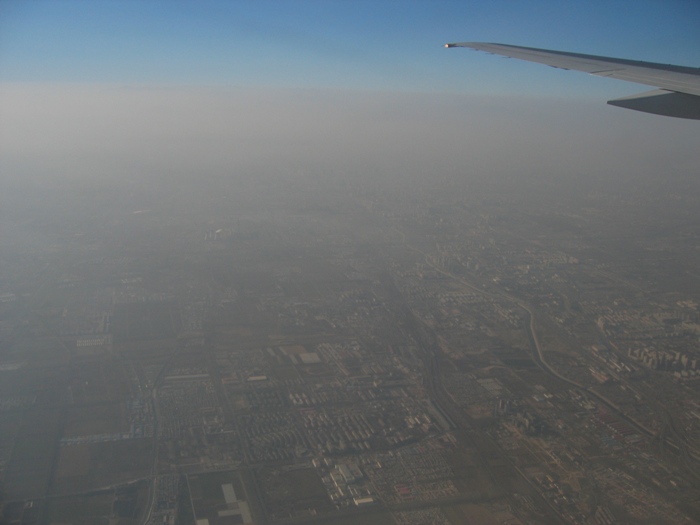
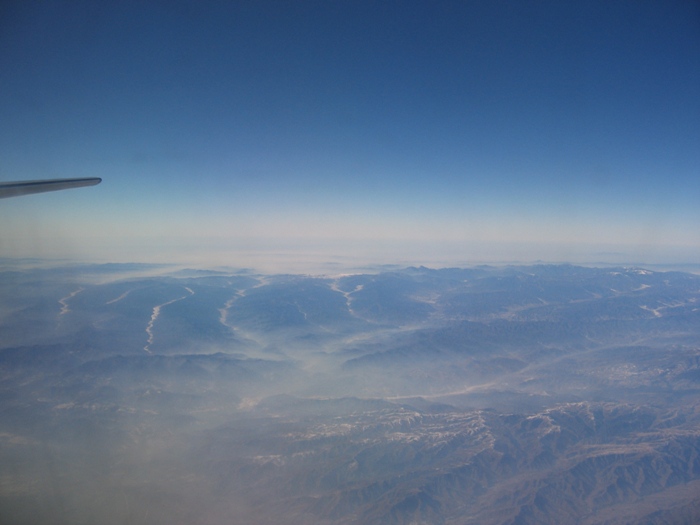
(Fig. 33) View of air pollution in the tributary valleys about 1 hour northeast of Xian in route to Beijing, looking north. Click for (hi res)
Air Pollution Three Gorges Damm (Yighang region)
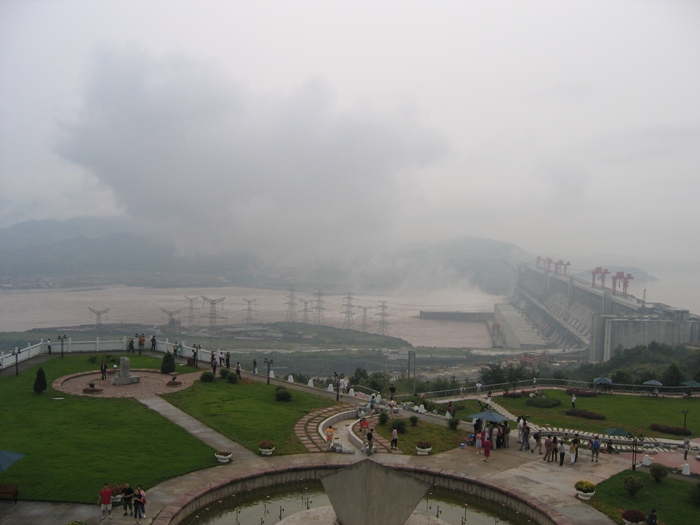
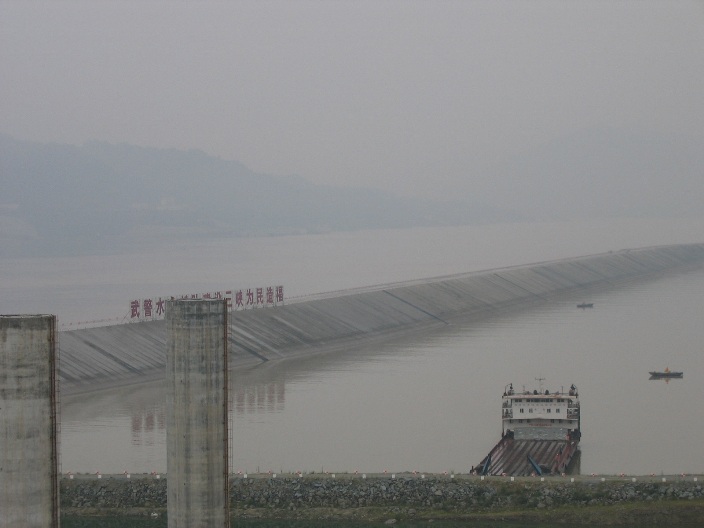
(Fig. 34) Wide angle view of Three Gorges Damm looking south (near Yichang). Note how the damm is generating it's own localized weather. Viablity about 4.0 miles (6.4 km). Click for (hi res)
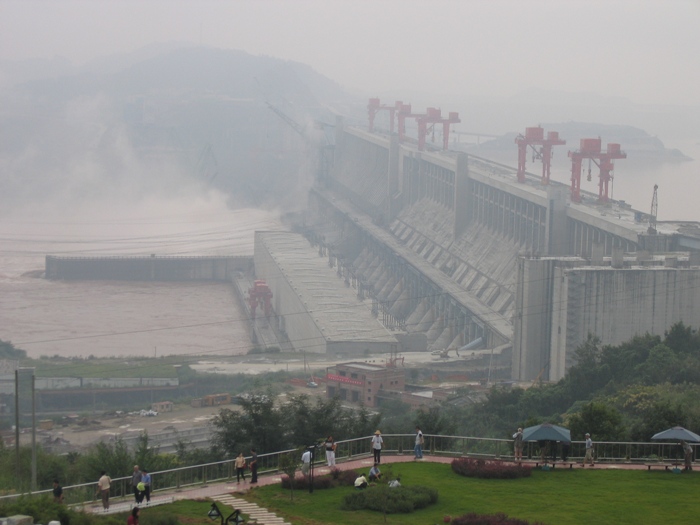
(Fig. 35) Three Gorges Damm looking southeast (Yichang region). Viablity about 1.75 miles (2.8 km). Click for (hi res)
(Fig. 36) Three Gorges Damm looking south (near Yichang). Viablity about 2.5 miles (4.0 km). Click for (hi res)
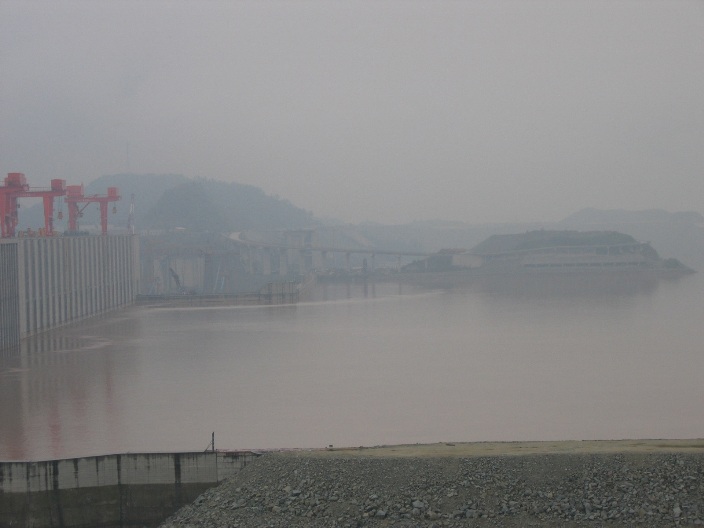
(Fig. 37) Three Gorges Damm, reservoir side looking southwest (near Yichang). Viablity about 2.0 miles (3.2 km). Click for (hi res)
(Vid. 8) Panorama video (less than stable) covering 330 degrees of the Three Gorges Damm complex and adjacent areas. (14.9 MB file, and may take a couple minutes to download). Visiblity about 2.5-4 miles (4.0-6.4 km). Click on the image to start the video. Quicktime application required.
Impact of Chinese air pollution on Taiwan (ROC)
Air Pollution Taipei
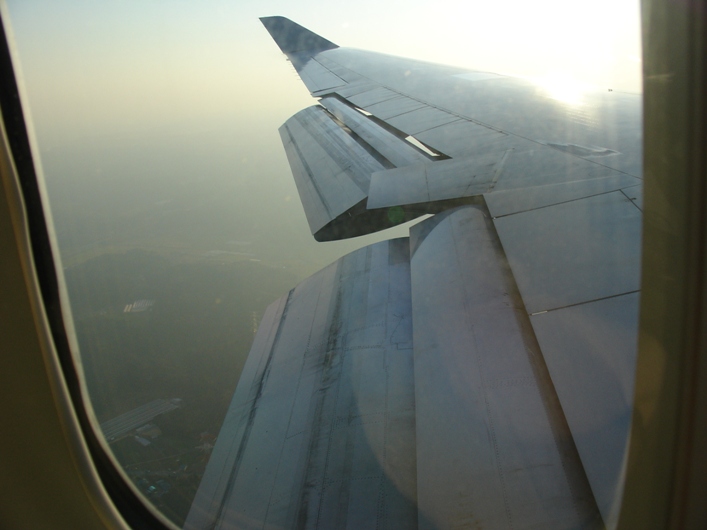
(Fig. 38) Taipei Airport arrival, Runway 23 looking south east towards the center of Taipei. Visiblity about 2.5 miles (4.0 km). Click for (hi res)
(Vid. 9) Video of Taipei Airport departure, initially looking to south east gradually rotating to the south as seen from Runway 23 (30 MB file, and may take a couple minutes to download). Click on the image to start the video. Windows MediaPlayer application required.
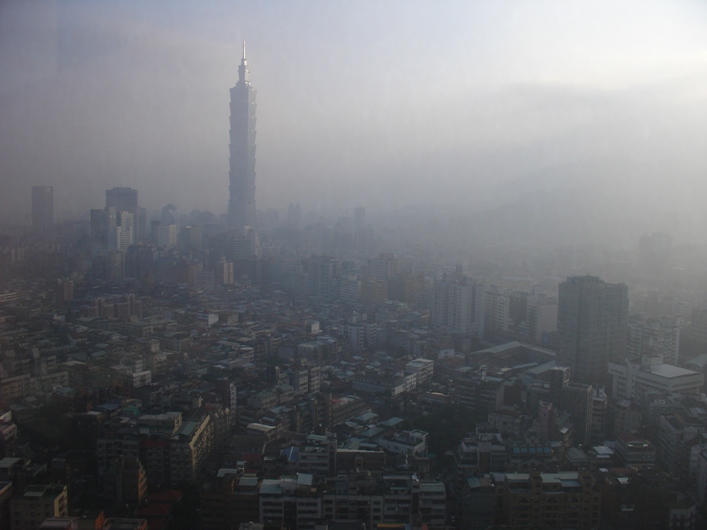
(Fig. 39) Air pollution in central Taipei, from Shangri la. Visiblity about 2.0 miles (3.2 km). Click for (hi res)
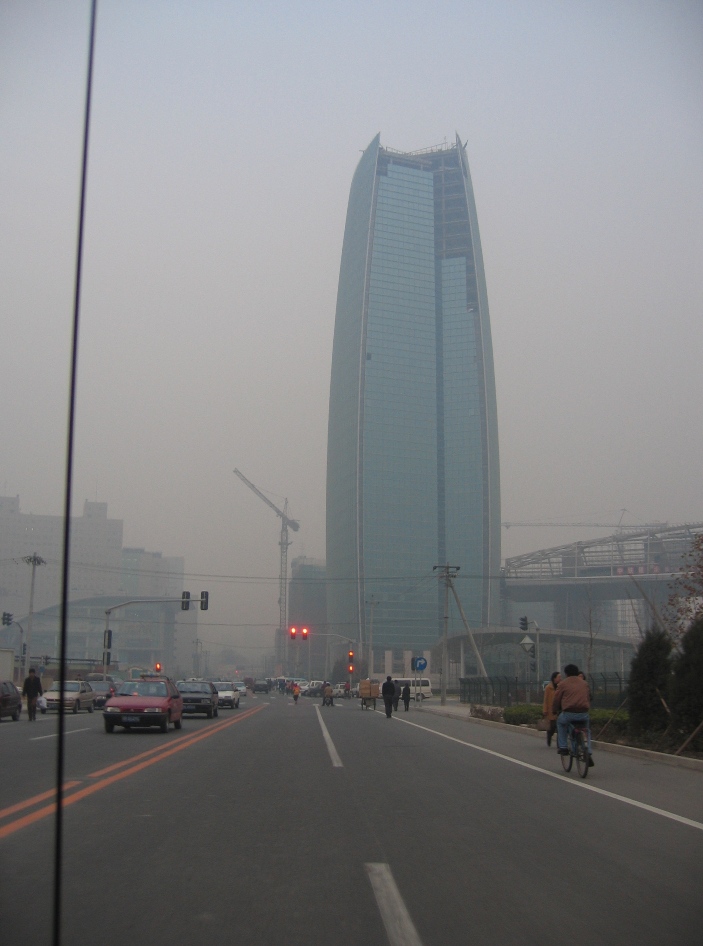
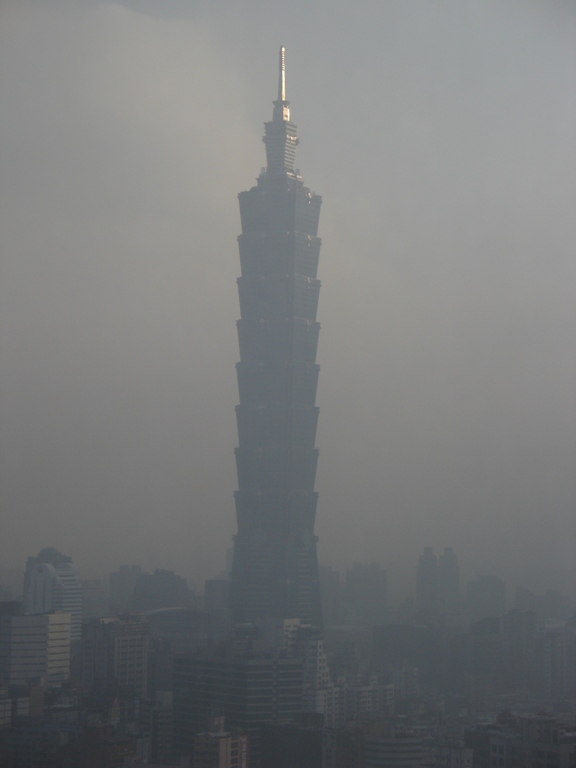
(Fig. 40) Air pollution in central Taipei, looking at building Taipei 101 from the Shangri La Hotel. Visibility about 2.0 miles (3.2 km). Note how the building spire on Taipei 101, ~1450' feet (442 m) above ground level, is the only part of the structure that is brightly illuminated by the Sun, yet at ground level, also in the path of direct Sun light appearing to be shadowed. The air particle density being so high, the nature of the particles absorbing across what appears to be all wavelengths of light (micro black bodies), that the sum of the optical effects, beyond the obvious loss of transmission, is similar to that of a neutral density (ND) filter. Click for (hi res)
Air Pollution Taichung
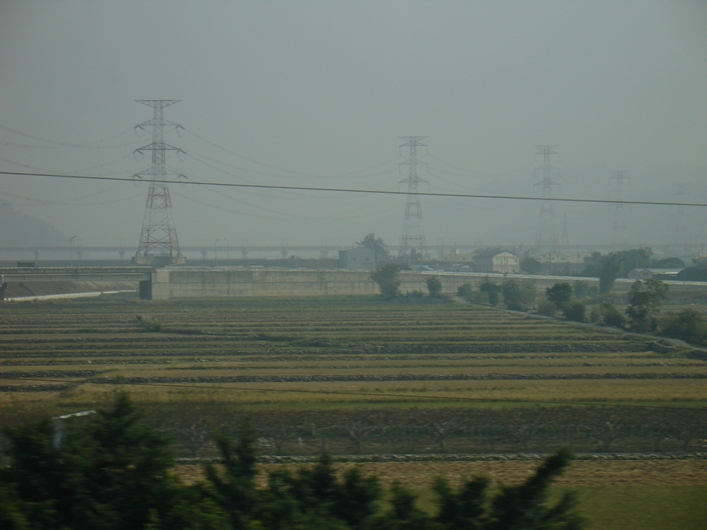
(Fig. 41) Air pollution in center Taiwan, from the Miaoli County - Taichung City line, looking east. Note how the 5th high voltage power line structure (~1.5 km) is barely visable. Visiblity about 1.5 miles (2.4 km). Click for (hi res)
Impact of Chinese Air Pollution on the Korean Pennisula
Air Pollution Seoul
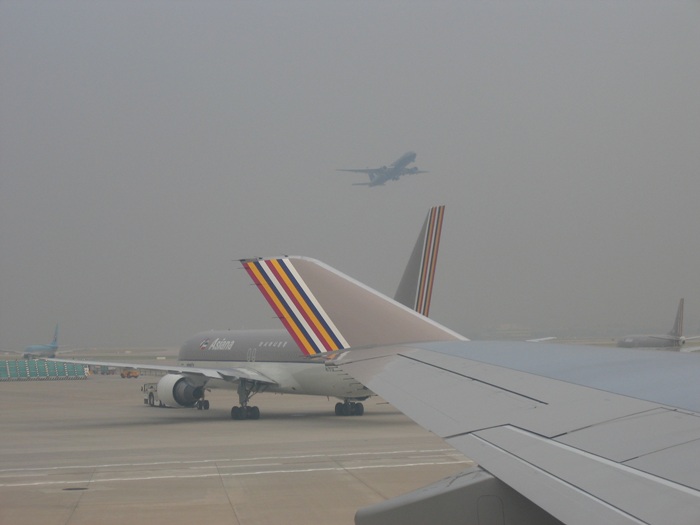
(Fig. 42) Inchon Airport outside of Seoul South Korea (ROK), looking northwest in the direction of Soeoul. Visiblity is about 1.5 miles (2.4 km). Click for (hi res)
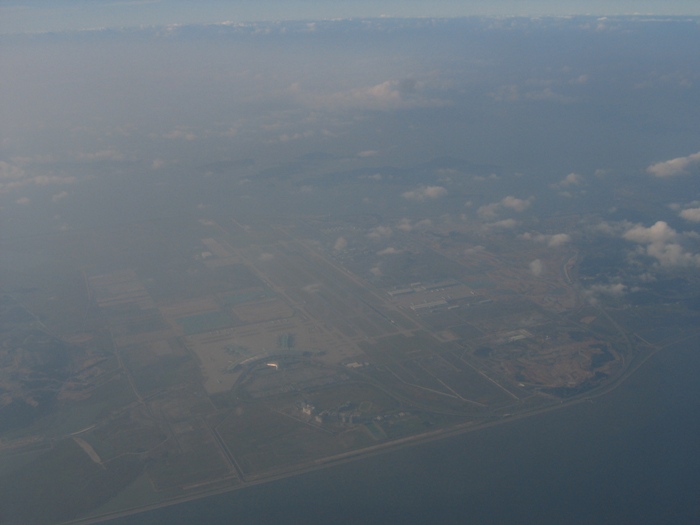
(Fig. 43) Inchon Airport (lower portion of frame) looking north towards North Korea. Note the large mass of orographic air pollution, pooling into a dense collection towards the upper left portion of the photo having arrived from China, completing the transit across the Bohai and Yellow Sea. The predominately Chinese sources for this air pollution being far too numerous to state. Click for (hi res)
(Vid. 10) Inchon Airport departure, looking to the northeast towards Seoul. The majority of the visible air pollution along the west coast of the Korean Peninsula coming from across the Yellow Sea from China, having traveled with the prevailing winds. (8.84 MB file, and may take a couple minutes to download). Click on the image to start the video. Windows MediaPlayer application required.
[xx]
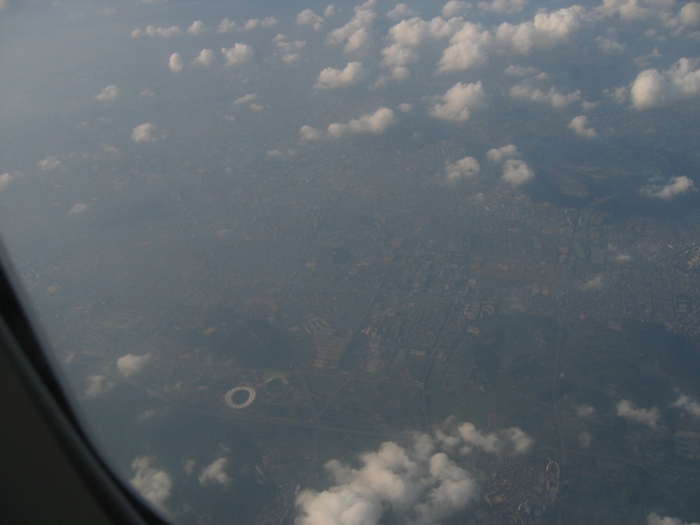
(Fig. 44) Inchon, and from this point, about 10 miles southwest of Seoul, heading east looking towards the north. Notice how the pollution, though downwind from the direction of the prevailing winds, is reducing in density. The slight gain in elevation and distance from the coast which is about 5 miles (8 km) away, permitting for cleaner, less polluted air. The dense mass of air pollution to the left of the frame, and over water, being greatly elevated in particulates and aerosols with the addition of air pollution that propagated across the Yellow and Bohai Seas from China. Click for (hi res)
Photos and video of air pollution in Mainland China (PRC), Taipei (ROC), and South Korea (ROK) taken by Park McGraw, 2004, 2005, 2006, 2007, 2009. All copyrights reserved.
Effects of Chinese Air Pollution on the Globe
Particle and Aerosol Air Pollution over the Pacific Ocean and Northern Hemisphere
[2]
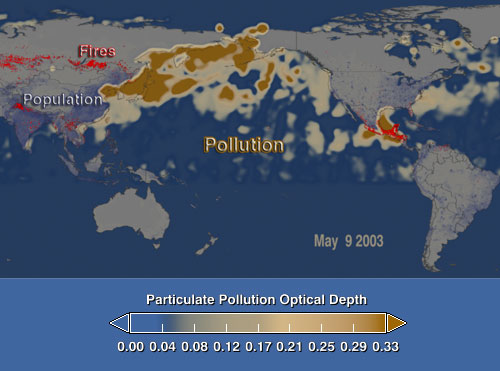
(Fig. 45) MODIS Satellite Data (NASA, 2003) showing air pollution optical density[3] and distribution patterns over the Pacific Ocean and Northern Hemisphere as it leaves the Asian continent. Click for (hi res)
[4]
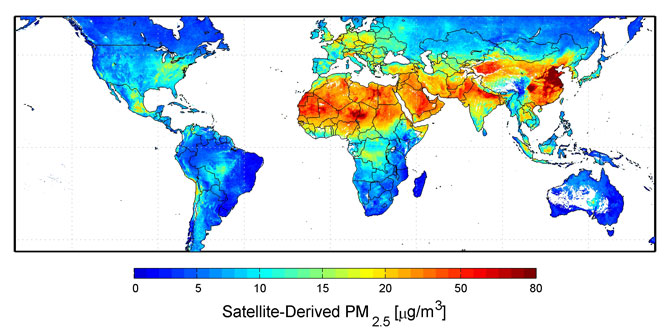
(Fig. 46) MODIS Satellite Data (NASA, 2006) showing the global distribution pattern of PM 2.5 (2.5 μm particle size),[5] air pollution particles with density in micro grams per cubic meter as seen over land surfaces.
Nitrogen Dioxide [NO2] levels over China and its Effects Upon the Entire Earth
[6]
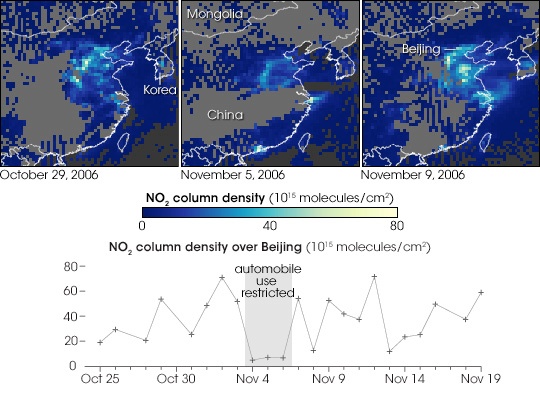
(Fig. 47) Aura EO Satellite Data (NASA GSFC, 2006) showing the level and distribution of nitrogen dioxide [NO2] levels over Beijing[7] and surrounding areas for both land and water covered surfaces. The level of detectable [NO2] noticeably dropping in the 5 Nov 2006 image as the use of automobiles were in central Beijing were temporarily restricted from 4 Nov - 6 Nov 2006.
[8]
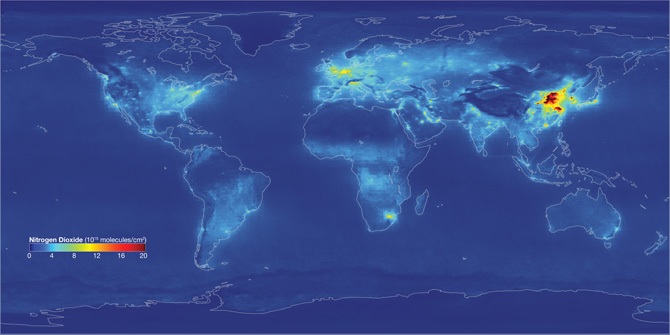
(Fig. 48) Aura EO Satellite Data (NASA GSFC, 2010) showing China's average Nitrogen Dioxide [NO2] emission levels and distribution pattern for 2010[9] relative to the entire Earth.
 [1]
[1]
 [xx]
[xx]
 [2]
[2]
 [4]
[4]
 [6]
[6]
 [8]
[8]